GO性能追踪trace+pprof
577 words
2 minutes
trace单干
 1
 2
 3
 4
 5
 6
 7
 8
 9
10
11
12
13
14
15
16
17
18
19
20
21
22
23
24
25
26
27
28
29
30
31
32
33
34
35
36
37
38
39
40
41
42
43
44
45
46
47
48
49
50
51
52
53
54
| package main
import (
"fmt"
"os"
"path/filepath"
"runtime"
"runtime/trace"
"sync"
)
func FbnqDp(n int) (s int) {
dp := make([]int, n+1)
dp[1] = 1
for i := 2; i < n+1; i++ {
dp[i] = dp[i-2] + dp[i-1]
}
return dp[n]
}
func Fbnq(n int) (s int) {
if n <= 2 {
return 1
}
return Fbnq(n-1) + Fbnq(n-2)
}
func main() {
runtime.GOMAXPROCS(1)
dir, err := os.Getwd()
if err != nil {
fmt.Println("获取目录路径失败!")
}
fileName := filepath.Join(dir, "test.pprof")
f, _ := os.Create(fileName)
trace.Start(f)
defer trace.Stop()
wg := sync.WaitGroup{}
wg.Add(2)
go func() {
defer wg.Done()
fmt.Println(Fbnq(40))
}()
go func() {
defer wg.Done()
fmt.Println(FbnqDp(40))
}()
wg.Wait()
}
|
1
| go tool trace test.pprof
|
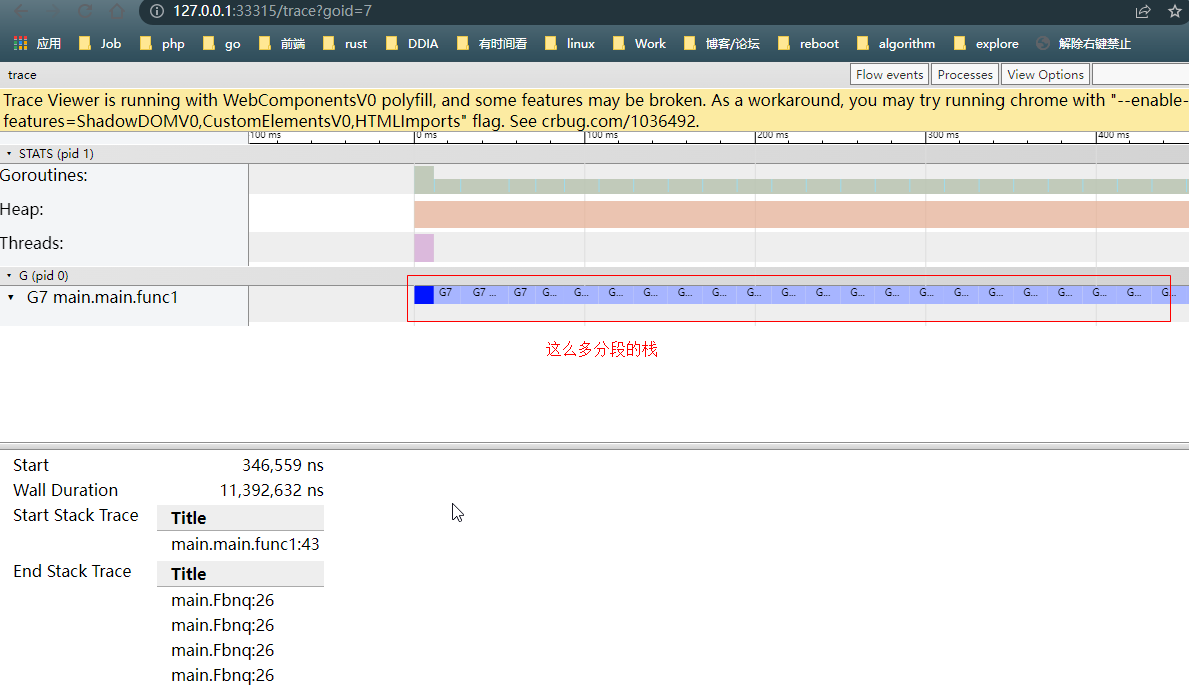
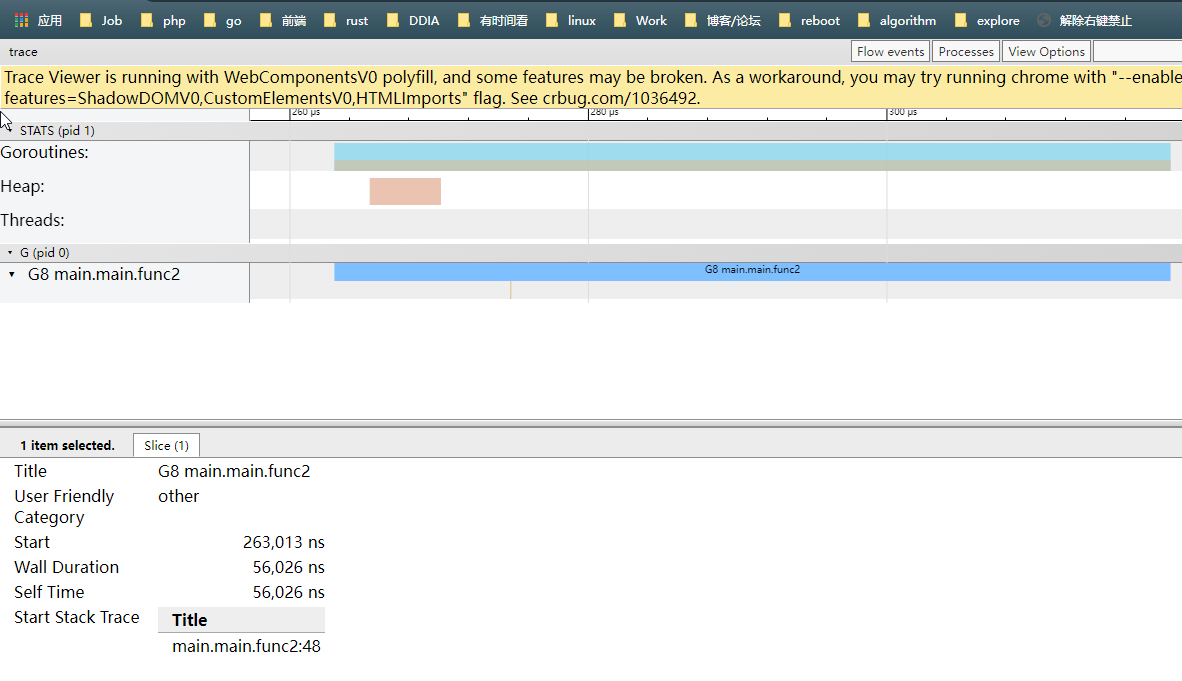
 trace
trace- 点击
Goroutine analysis ,查看两个go协程的性能 - 对于暴力递归写的斐波那契函数:
tracetrace配合pprof
- 注意手动加上
_ "net/http/pprof"
 1
 2
 3
 4
 5
 6
 7
 8
 9
10
11
12
13
14
15
16
17
18
19
20
21
22
23
24
25
26
27
28
29
30
31
32
33
34
35
36
37
38
39
40
41
42
43
44
45
46
47
| package main
import (
"fmt"
"log"
"net/http"
_ "net/http/pprof"
"os"
)
func FbnqDp(n int) (s int) {
dp := make([]int, n+1)
dp[1] = 1
for i := 2; i < n+1; i++ {
dp[i] = dp[i-2] + dp[i-1]
}
return dp[n]
}
func Fbnq(n int) (s int) {
if n <= 2 {
return 1
}
return Fbnq(n-1) + Fbnq(n-2)
}
func main() {
go func() {
if err := http.ListenAndServe(":6060", nil); err != nil {
log.Fatal(err)
}
os.Exit(0)
}()
http.HandleFunc("/hello", func(w http.ResponseWriter, req *http.Request) {
w.Write([]byte("Hello World!"))
})
http.HandleFunc("/Fbnq", func(w http.ResponseWriter, req *http.Request) {
fmt.Println(Fbnq(10))
})
http.HandleFunc("/FbnqDp", func(w http.ResponseWriter, req *http.Request) {
fmt.Println(FbnqDp(10))
})
http.ListenAndServe(":8080", nil)
}
|
 1
 2
 3
 4
 5
 6
 7
 8
 9
10
11
12
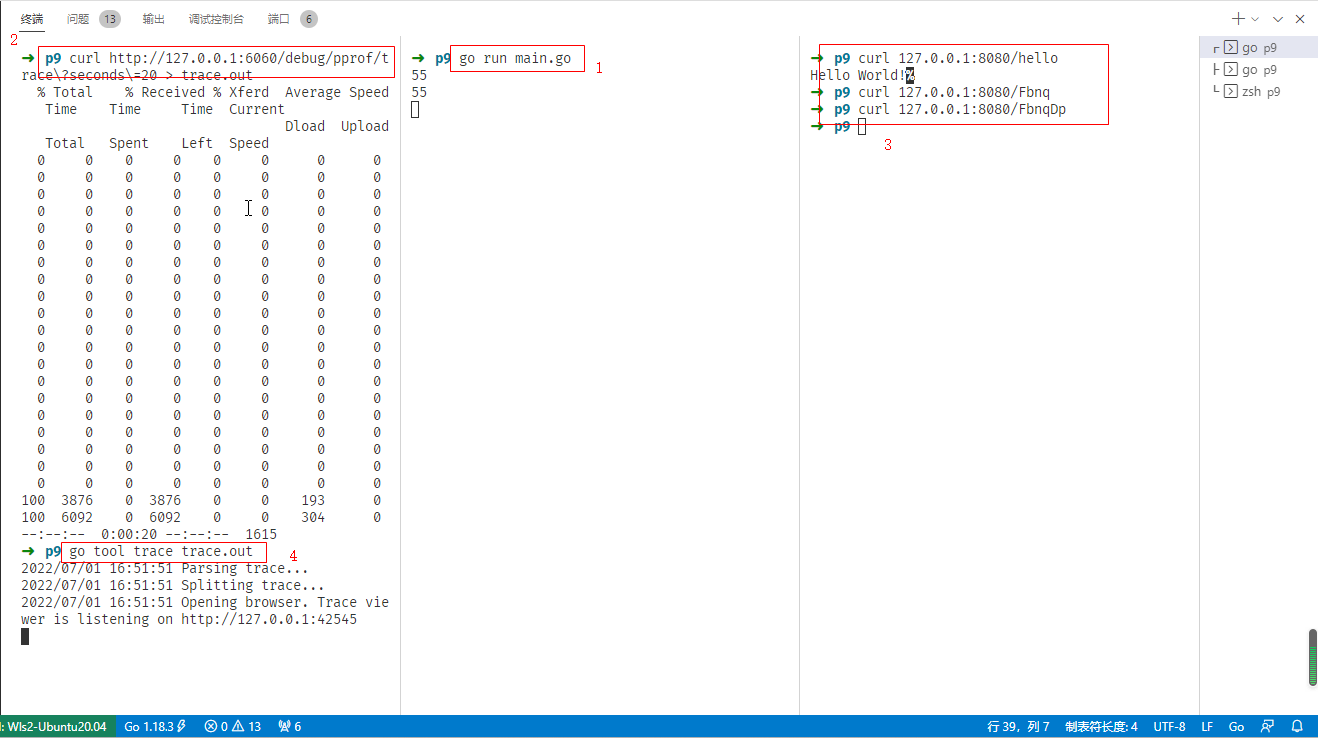
| ➜ p9 go run main.go
# 20s是抓取时长,这期间的访问都会被记录到
➜ p9 curl http://127.0.0.1:6060/debug/pprof/trace\?seconds\=20 > trace.out
# 所以下面的命令需要在上面的命令执行后的20s内执行
➜ p9 curl 127.0.0.1:8080/hello
Hello World!%
➜ p9 curl 127.0.0.1:8080/Fbnq
➜ p9 curl 127.0.0.1:8080/FbnqDp
➜ p9 go tool trace trace.out
|
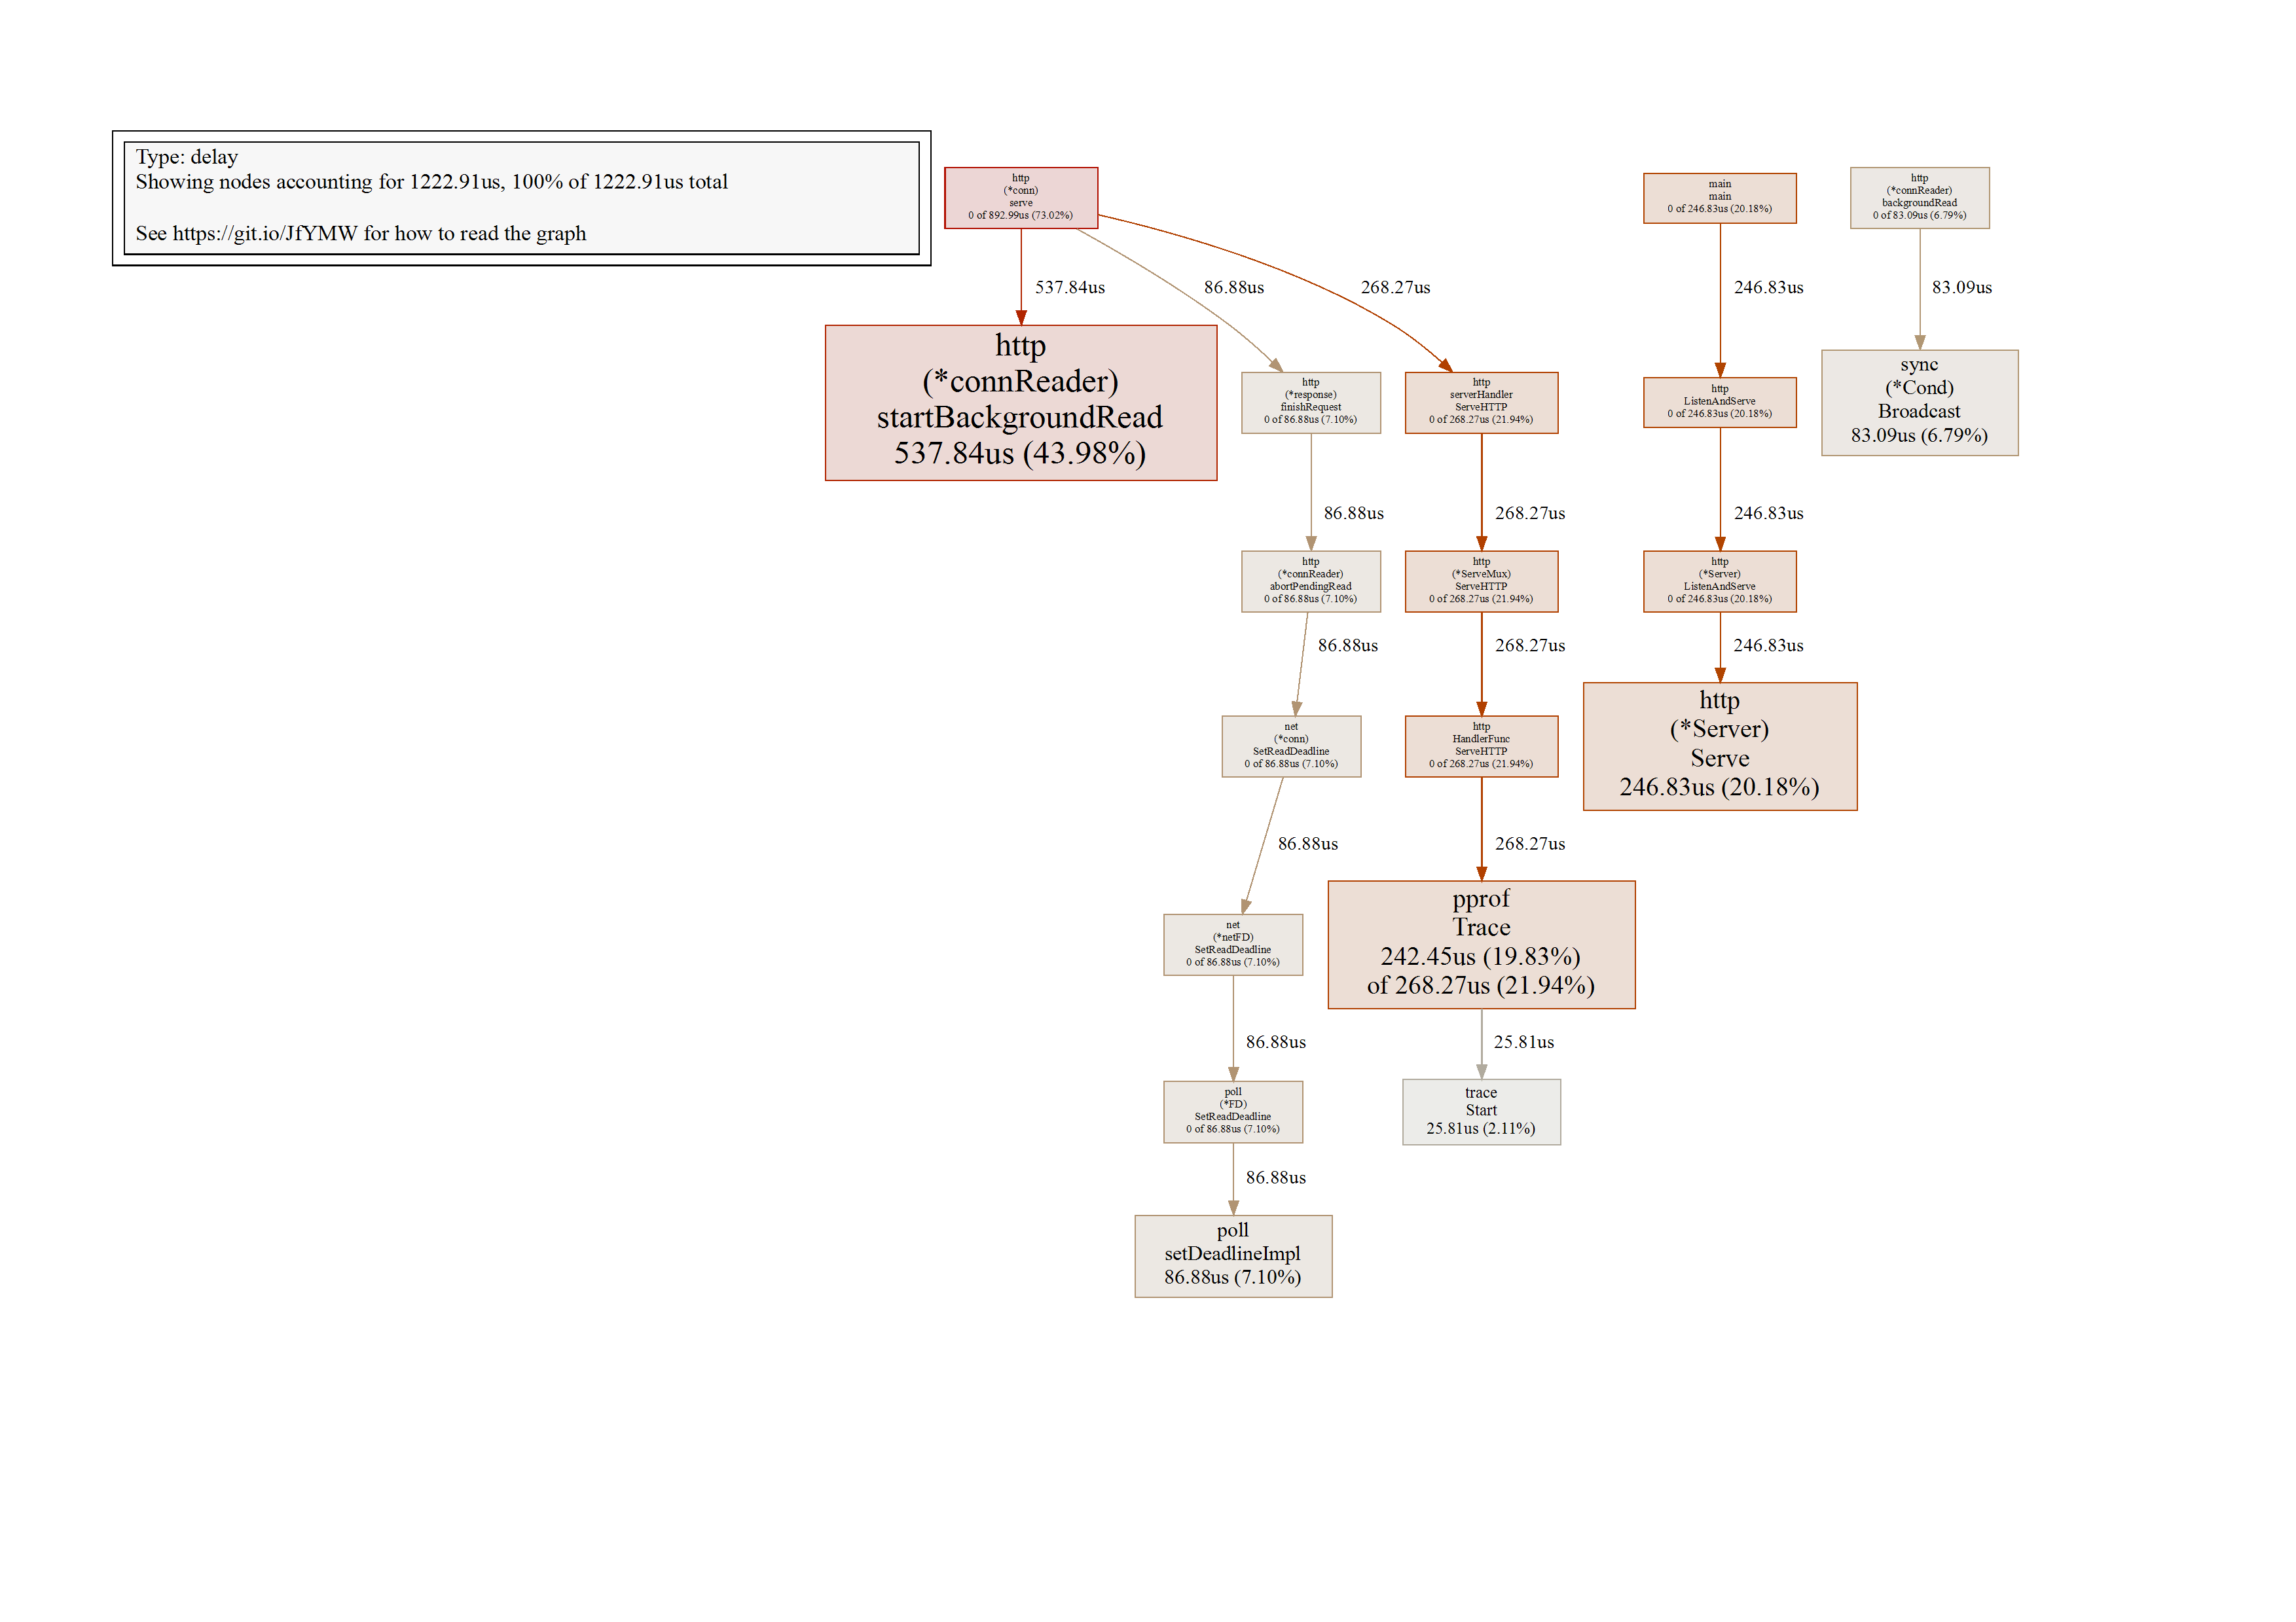
- 点击
Scheduler latency profile
trace